Best Practices for Sensor Deployments
- Use site surveys and AP floor plans to identify where sensors should be placed.
- Sensors need good signal strength from APs to achieve reliable results.
- Avoid metallic surfaces, and no closer than 2 meters/6 feet from an AP.
- Place in the most centralized location to maximize the coverage of one sensor.
- For areas with high ceilings (> 5 meters/15 feet), install to same elevation as APs, or slightly below if possible.
- Use PoE 802.3af to power sensors.
- Mount sensor 6200/2200 units to the ceiling using mounting brackets provided. Step-by-step instructions found here.
- They may also be placed on top of furniture or shelves.
- Sensor 250 units are best to install at human elevation, on shelves, walls, under tables.
- If not mounted with fixed bracket, the sensor should not be moved during monitoring.
- Use NEMA enclosures if environmental aspects require it.
Using the Setup Wizard
The setup wizard is designed to identify all access points at -65dBm or better. This is generally 4 to 6 APs. Please have your network keys on hand before you begin.
In the Configurator, go to Tools > Setup Wizard
Sensor duty-cycle management:
- Do not configure more that 6 APs per sensor.
- Try to limit monitoring to no more than 4 SSIDs.
- Consider whether monitoring the 2.4GHz network is necessary.
- Shorter duty-cycles lead to more responsive test results.
- Configure a cloud Sonar endpoint (see below).
Sonar Endpoint
During the Setup Wizard process, you will be asked to configure a Sonar endpoint for active tests, like throughput, packet loss, and jitter.
Installing Sonar on your WAN is recommended. Virtual machine templates, as well as additional Sonar assistance may be found here.
To start, use a cloud Sonar from the table below.
Add Locations and Names
- It's a best practice to properly name your locations, service areas, access points and sensors. The more descriptive the better for accurate reporting.
- You may export a list of base radio MAC addresses and AP names from your controller and send a CSV file to 7SIGNAL. We will import the names into the system.
- Log the MAC addresses of sensors and their service areas to which they belong in a spreadsheet (see example below).

Define Service Level Agreements (SLAs)
IT and The Business “agree” to a performance target for a particular key performance indicator (KPI). For example: we always want our employees to achieve 10 Mb/s of download throughput on the corporate network.
Measuring Adherence
sensors take samples every few minutes…- 15 Mb/s – meets SLA
- 12 Mb/s – meets SLA
- 4 Mb/s
- 11 Mb/s – meets SLA
- 14 Mb/s – meets SLA
Four out of 5 samples fall into the SLA bucket for an 80% service level percentage of compliance.
Recommended SLA Targets and Compliance Percentages
SLAs may be set per SSID. For example, your target throughput for your guest network may be 1 Mb/s.
|
KPI |
Target |
Green Until… |
Yellow Until… |
|
Beacon availability |
100% |
80% |
70% |
|
Radio attach success rate |
100% |
90% |
80% |
|
EAP auth. success rate |
100% |
98% |
90% |
|
DHCP success rate |
100% |
90% |
80% |
|
Ping success rate |
100% |
70% |
50% |
|
HTTP DL throughput |
>=5 Mbit/s |
90% |
80% |
|
HTTP UL throughput |
>=5 Mbit/s |
90% |
80% |
|
Ping RTT |
<=100 ms |
70% |
50% |
|
VoIP MOS DL (listening) |
>=3.6 |
80% |
70% |
|
VoIP MOS DL (talking) |
>=3.6 |
80% |
70% |
|
AP retries |
<=40% |
70% |
50% |
|
Client retries |
<=40% |
70% |
50% |
|
Airtime utilization |
<=40% |
50% |
30% |
Recommended Alarms
- Managed Access Point Not Responding
- Attach availability
- RADIUS server reachability success rate
- Total EAP authentication success rate
- DHCP server unreachable
- VoIP MOS, listening performance
- HTTP Download performance
- HTTP Upload performance
Schedule Automated Reports
These reports will be emailed to you from 7SIGNAL's SMTP server in the cloud. If you skipped this step in the Setup Wizard, then please contact 7SIGNAL Support so that it can be configured.
During the Setup Wizard process you would have also configured the email addresses to receive reports. As a best practice, you should receive automated reports via email twice a week.
- Monday morning report - covers performance for Thursday through Sunday
- Thursday morning report - covers performance for Monday through Wednesday
- Reports should be emailed to a network administrator responsible for checking up on the health and wellness of the WLAN.
Dashboard Setup and Best Practices
The Dashboard in Analyzer is an effective tool for monitoring the performance of many service areas at once on a large screen. It can be set to auto-refresh and will also display alarms.
Recommended Settings
Login to Analyzer and click the Dashboard tab along the top. Then expand the Settings.
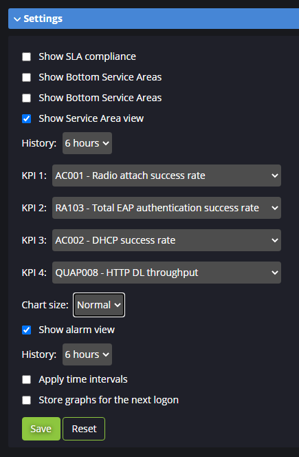
- Select Show Service Area view with a history of 6 hours.
- Select Radio attach success rate for KPI 1 to indicate when sensor(s) in the service area are no longer able to connect to an access point.
- Choose Total EAP authentication success rate as KPI 2 to identify EAP authentication failures.
- For KPI 3, select DHCP success rate to quickly see if DHCP services are down.
- Finally, choose HTTP DL throughput for KPI 4 to be your Wi-Fi experience indicator for all service areas monitored.
- Set chart size to normal and check Show alarm view with a 6 hour history.
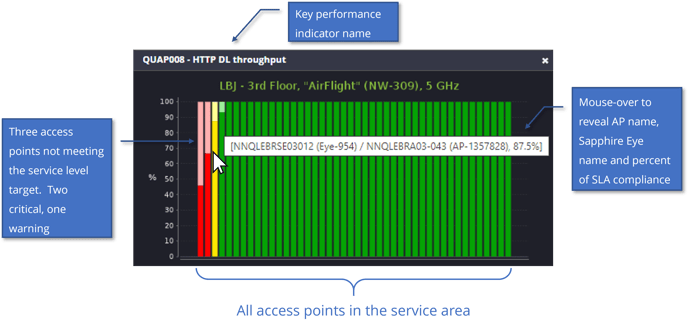
Once configured, go to the upper right corner of Analyzer, check the refresh box, and click Report. A sample screenshot of the output is below...
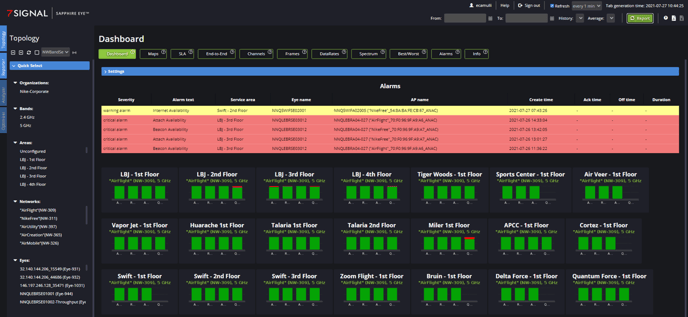
Click on any green bar in any service area to zoom-in to access point performance data...